The Cultural Analytics Course is a Swirl-based interactive learning environment. Swirl is a ‘software package for the R programming language that turns the R console into an interactive learning environment’ (swirl | FAQ).
Swirl has been designed specifically for training purposes and is based on R, ‘a system for statistical computation and graphics. It consists of a language plus a run-time environment with graphics, a debugger, access to certain system functions, and the ability to run programs stored in script files’ (Hornik, 2018). R is allows users to perform a number of functions, including ‘linear and generalized linear models, nonlinear regression models, time series analysis, classical parametric and nonparametric tests, clustering and smoothing’ (Hornik, 2018).
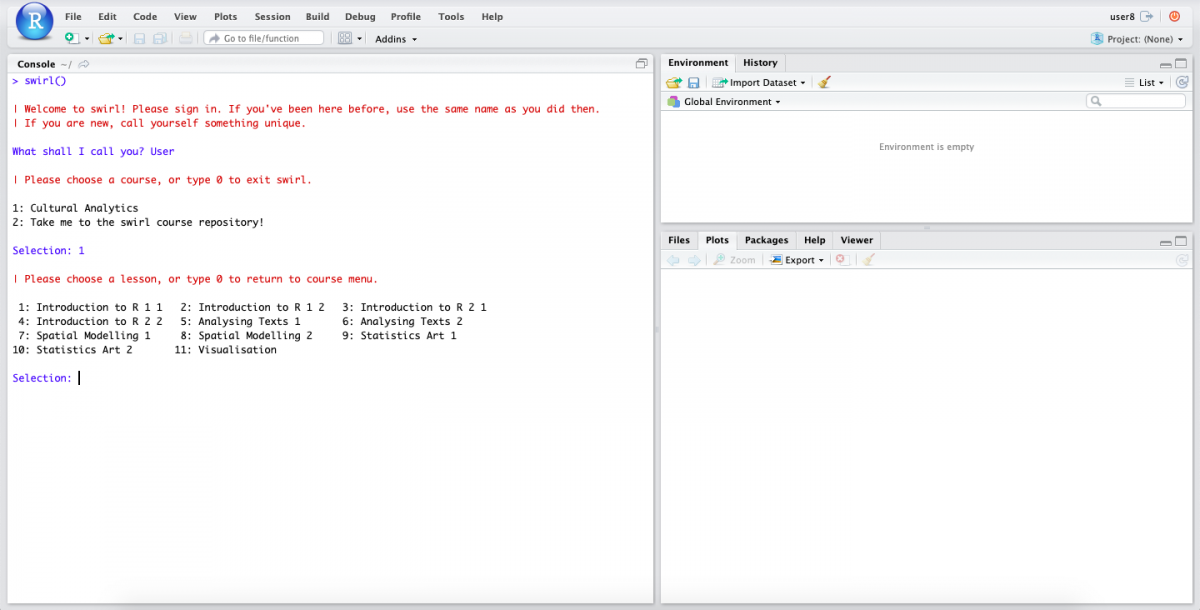 The beginning of the Cultural Analytics Course with its lesson menu
Moreover, R is capable of providing ‘a flexible graphical environment for creating various kinds of data presentations’ (Hornik, 2018). The Cultural Analytics Course Swirl package is designed to run in RStudio, which is ‘integrated development environment for R’ (RStudio) which includes ‘a console, syntax-highlighting editor that supports direct code execution, as well as tools for plotting, history, debugging and workspace management’ (RStudio). Thus, the Cultural Analytics Course exploits all of R’s features, combining them into an interactive learning environment. This allows users to have a hands-on experience of different analysis, plotting and visualisation tools within the frame of a dedicated software package. Moreover, users can experiment with tools, self-assess their progress and further explore R’s features using numerous sources and references provided during the course.
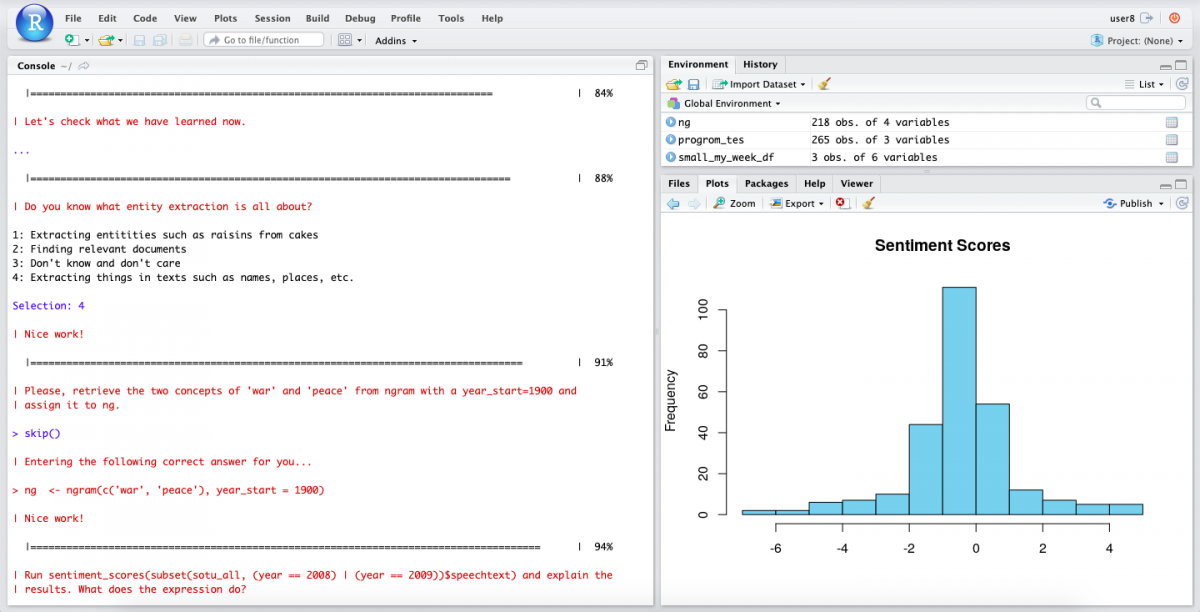 An example of self-assessment at the end of a lesson
The Cultural Analytics Course provides an in-depth introduction to R and its basic functions across four different areas. The course then devotes two lessons to each to text analysis, spatial modelling and statistic art. The course’s final lesson focuses on visualisation.
Hence, the Cultural Analytics course provides users with a complete overview of R-based tools and allows users to perform self-assessment via a set of questions which recap each lesson. The course’s goal is to provide users with a knowledge base that will allow users to apply R-based tools to datasets of interest. Thus, once they have completed the course, users will be able to perform analysis on their datasets, apply knowledge extraction methods and create visualisations autonomously.
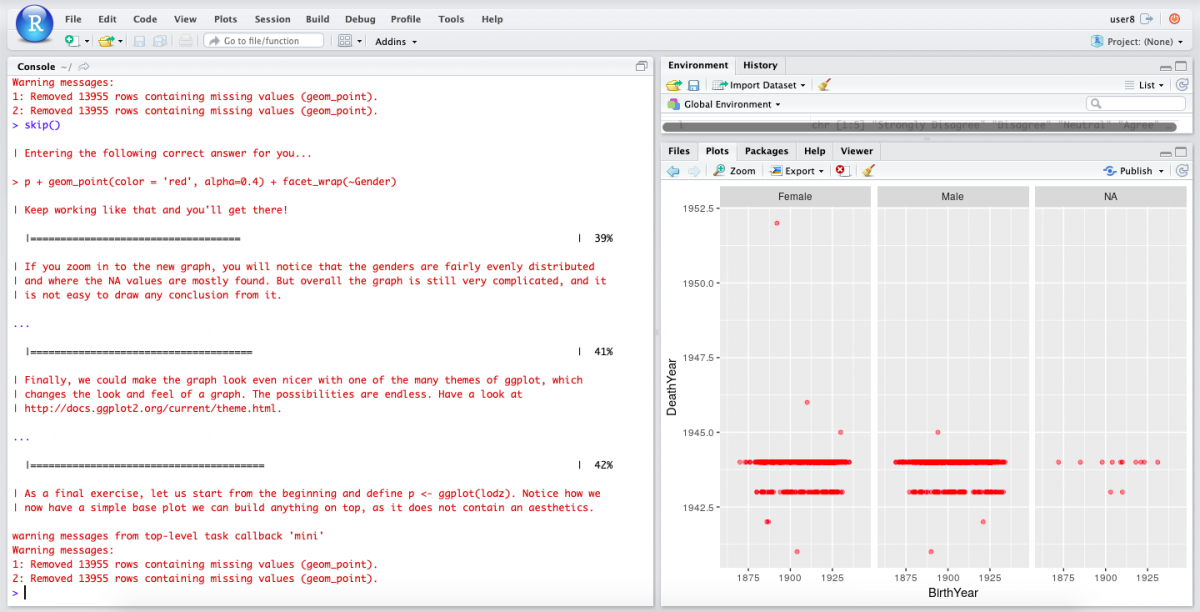 Plot derived from an EHRI dataset on the Lodz Ghetto Population
Within the frame of European Holocaust Research Infrastructure project, this course allows users to acquire competences that can be used to analyse real life-based datasets, as demonstrated by the Holocaust-based examples provided during the course. Once they have completed the course, users will be able to implement a number of tools within R and also will have gained further knowledge on textual analysis, spatial modelling, statistics and visualisation tools.